Which WebP Quality to Use for Photos, Screenshots and Graphics
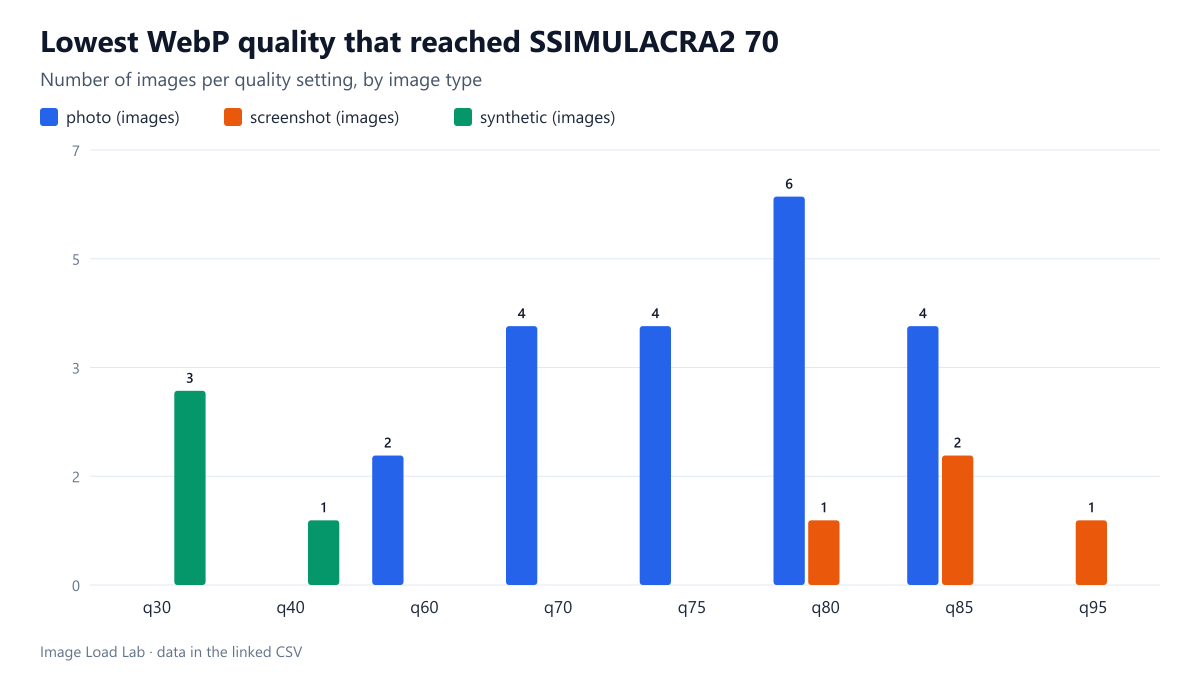
Across 28 images, the lowest WebP quality reaching SSIMULACRA2 70 ranged from 30 for flat graphics to 95 for a screenshot. One setting does not fit all.
Most tools ship one WebP quality setting for everything, usually 75 or 80. Is one number right for photographs, screenshots and flat graphics alike? We encoded 28 images of three kinds at ten WebP quality settings and looked for the lowest setting that reaches a fixed visual quality for each one. The answer is no: the right setting ranged from 30 to above 95 depending on what was in the picture.
What we tested
- 20 photographs from our CC0 corpus (landscapes, food, fur, feathers, night scenes, text on a sign, dunes and more), each resized to a 1600-pixel long edge.
- 4 real screenshots of this website captured by Chrome at 1280 × 800: the home page, a guide, the srcset tool and the methodology page. They mix small text, flat backgrounds and a few colour accents.
- 4 synthetic graphics generated by code: a smooth gradient, a flat vector illustration, dense line art and a bar chart.
Every image was encoded with libwebp 1.6.0 through sharp at quality 30, 40, 50, 60, 70, 75, 80, 85, 90 and 95 (effort 4), and every output was scored with SSIMULACRA2 against its lossless source, following our methodology. Our target is a score of 70, which libjxl describes as “high quality”: artefacts are hard to notice without comparing with the original.
Lowest WebP quality that reached SSIMULACRA2 70
| Image | Type | Lowest q for score ≥ 70 | KB at that q | Lowest q for score ≥ 80 | Score at q75 | KB at q75 |
|---|---|---|---|---|---|---|
| animal-fur | photo | 80 | 210.7 | 90 | 66.807 | 158.8 |
| architecture | photo | 80 | 108.5 | 90 | 67.212 | 90.1 |
| beach-sky | photo | 85 | 260.0 | 95 | 67.265 | 165.1 |
| bicycle | photo | 75 | 117.6 | 90 | 70.688 | 117.6 |
| bird | photo | 85 | 332.9 | >95 | 63.564 | 228.3 |
| car | photo | 75 | 222.3 | 85 | 70.59 | 222.3 |
| city-night | photo | 80 | 192.1 | 95 | 66.011 | 156.6 |
| coffee | photo | 80 | 55.7 | 90 | 69.78 | 45.8 |
| desert | photo | 85 | 117.0 | 90 | 62.363 | 70.0 |
| flower | photo | 75 | 37.0 | 90 | 71.327 | 37.0 |
| food | photo | 75 | 117.3 | 90 | 70.45 | 117.3 |
| forest | photo | 80 | 112.8 | 90 | 68.09 | 85.4 |
| interior | photo | 70 | 410.5 | 85 | 73.464 | 427.8 |
| landscape | photo | 85 | 141.3 | 95 | 63.167 | 86.1 |
| market | photo | 70 | 71.6 | 90 | 71.456 | 75.6 |
| snow | photo | 70 | 464.5 | 90 | 72.465 | 497.9 |
| street-sign | photo | 70 | 519.2 | 85 | 74.682 | 536.7 |
| sunset | photo | 80 | 180.8 | 90 | 66.4 | 145.0 |
| texture-rock | photo | 60 | 384.7 | 80 | 76.391 | 471.3 |
| waterfall | photo | 60 | 528.6 | 85 | 75.262 | 608.3 |
| guide | screenshot | 85 | 65.4 | >95 | 67.192 | 49.5 |
| home | screenshot | 95 | 77.5 | >95 | 65.63 | 36.3 |
| methodology | screenshot | 85 | 43.6 | >95 | 67.143 | 32.6 |
| srcset-tool | screenshot | 80 | 33.5 | >95 | 69.491 | 29.5 |
| chart-ui | synthetic | 30 | 12.0 | 70 | 81.471 | 15.7 |
| flat-illustration | synthetic | 30 | 12.0 | 70 | 81.861 | 17.2 |
| gradient | synthetic | 40 | 8.2 | 90 | 75.635 | 10.6 |
| line-art | synthetic | 30 | 156.6 | 70 | 81.625 | 222.3 |
- Photographs needed anything from quality 60 to 85. The most common answer was 80 (6 of 20 photos). At the popular default of 75, the median photo scored 70.1, just on the line, with a range from 62.4 (the dunes, whose smooth sand gradients band) to 76.4 (the stone texture, where noise hides artefacts).
- Screenshots needed quality 80 to 95. At quality 75 none of the four reached 70; the median score was 67.2. Small anti-aliased text is where lossy WebP’s colour subsampling and smoothing show first.
- Synthetic flat graphics reached 70 at quality 30 or 40, the bottom of our ladder. Flat areas compress almost perfectly; at quality 75 their median score was already 81.5.
At a stricter target the categories split further
With a target of SSIMULACRA2 80, photos mostly needed quality 90 (11 of 20); three needed 95 and one, the duck feather macro, never got there within the ladder. None of the four screenshots reached 80 even at quality 95. For screenshots that must stay crisp, lossy WebP is the wrong tool. Lossless WebP or PNG is, and we measured that trade-off in a separate screenshot test.
What the choice costs in bytes
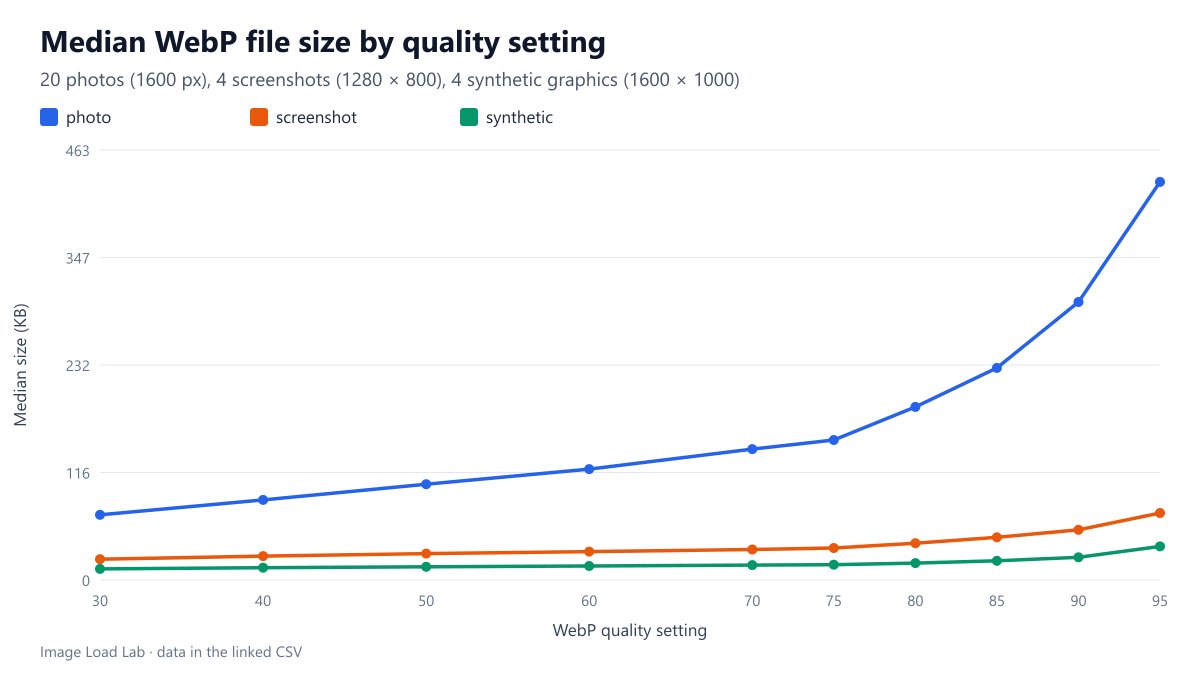
For photos, going from quality 75 to 90 roughly doubled the median file (150.8 KB to 299.4 KB) to lift the median score from 70.1 to 82.3. For synthetic graphics, the same step cost only 8 KB (16.5 KB to 24.5 KB). The expensive mistake is not using a quality that is slightly too low for graphics. It is using a quality that is too high for every photograph “to be safe”.
Practical settings from this run
| Image type | Starting WebP quality | Why |
|---|---|---|
| Photographs, general | 75–80 | Median photo reached 70 at 75; 80 covered 16 of 20 |
| Photos with smooth gradients (sky, sand, water reflections) | 85 | The dunes, beach, lake and feather photos needed 85 |
| Busy, detailed photos (stone texture, waterfall, street scenes, interiors) | 60–70 | Texture masks artefacts; 60 or 70 was enough for these six |
| Flat illustrations, charts, diagrams | Lossless, or lossy 50–70 | Reached 70 at 30–40; files stay tiny either way |
| Screenshots with text | Lossless WebP (or lossy ≥ 90) | Lossy never reached 80; needed 80–95 to reach 70 |
If your pipeline can only use one number, 80 is the most defensible single setting for photos in this run, but a per-category setting is better, and a per-image target (encode until a metric threshold is reached) is better still.
Repeat this test on your own images
To pick a setting for your own site, choose three or four images of each type you publish, encode each at a few WebP qualities, and score them against the originals:
for q in 60 70 75 80 85 90; do
  cwebp -q $q -m 4 shot.png -o shot-q$q.webp
  dwebp shot-q$q.webp -o d.png && ssimulacra2 shot.png d.png
done
The lowest setting that clears your target for every image of a type is that type’s setting. Our scripts run_codecs.py and analyze_codecs.py do the same for the 28 images used here.
Limitations
These are results for libwebp 1.6.0 at effort 4 with default settings. The “sharp YUV” conversion option improved screenshot scores considerably, which we measured separately in our chroma subsampling test. SSIMULACRA2 thresholds are a proxy for human judgement, and our screenshots come from a dark-themed site with light text, which is harder than black text on white.
Data and files
Download webp-by-type.csv (28 rows, 1.6 KB) · Download codecs.csv (1036 rows, 105.3 KB) · Method: testing methodology. Photos: image credits.