Charts as SVG, PNG, WebP or AVIF: What Each Format Costs
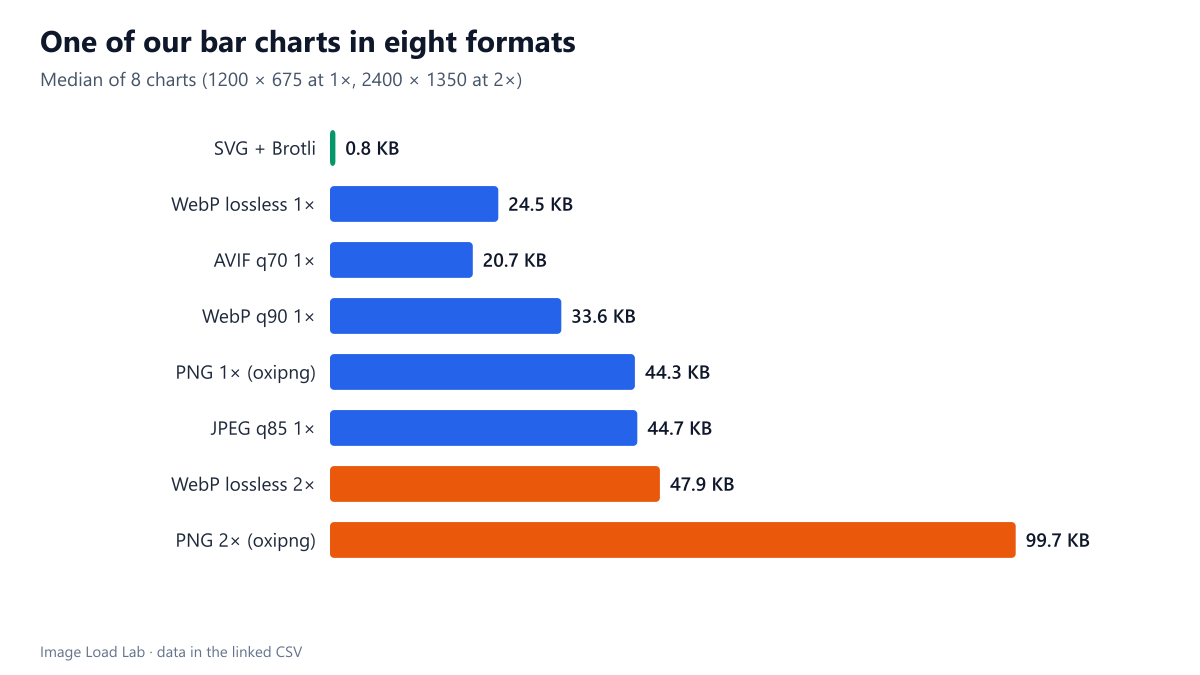
Our bar and line charts were 0.8 KB as Brotli-compressed SVG and 21 to 45 KB as raster images at 1×, doubling at 2×. SVG was 26 to 140 times smaller than any raster format.
Charts, diagrams and data visualisations are a large part of many technical pages, including this one. They can be published as SVG, which the browser draws, or as raster images such as PNG, WebP, AVIF or JPEG. How large is the same chart in each format, at normal and at high pixel density? We exported eight of our own bar and line charts in eight ways.
The test
The charts are eight figures from our guides, produced as SVG by our Python scripts at 1200 × 675 pixels. Each SVG was measured raw and after gzip and Brotli compression, and after SVGO. The same SVG was then rendered with librsvg at 1× (1200 × 675) and 2× (2400 × 1350) and saved as PNG optimised with oxipng level 2, lossless WebP, WebP at quality 90, AVIF at quality 70 and MozJPEG at quality 85. We report the median of the eight charts. See our methodology.
Results
| Format | Median KB | Times the SVG + Brotli size |
|---|---|---|
| SVG + Brotli | 0.8 | 1× |
| WebP lossless 1× | 24.5 | 31× |
| AVIF q70 1× | 20.7 | 26× |
| WebP q90 1× | 33.6 | 43× |
| PNG 1× (oxipng) | 44.3 | 56× |
| JPEG q85 1× | 44.7 | 57× |
| WebP lossless 2× | 47.9 | 61× |
| PNG 2× (oxipng) | 99.7 | 127× |
| SVG uncompressed | 4.5 | 6× |
SVG was 26 to 140 times smaller than any raster version. The median chart was 4.6 KB as raw SVG and 0.8 KB after Brotli, the way a server would normally send it. The smallest raster at 1× was AVIF at 20.7 KB, then lossless WebP at 24.5 KB; PNG and JPEG were both about 44 KB.
High-density screens double the raster cost but not the SVG cost. To look sharp on a 2× screen, a raster chart needs twice the width and height. At 2× the median lossless WebP was 47.9 KB and the PNG 99.7 KB, while the SVG stays the same file at any density, because the browser draws it at the resolution of the screen.
JPEG was the wrong raster format for charts. At quality 85 it was as large as PNG at 1× and larger at 2× (110.7 KB), and lossy compression blurs thin lines and text. Lossless WebP was about half the size of PNG at both densities.
What SVG costs instead
- Fonts: text in an SVG is drawn with fonts available on the visitor’s device. Our charts name “Segoe UI” with Arial as fallback, so they look slightly different on systems without those fonts. A raster image looks the same everywhere.
- Complexity: charts with thousands of points or heavy filters can take longer to draw than a raster image takes to decode. Our charts have a few dozen shapes; a scatter plot of 50,000 points would be a different case.
- Accessibility: text in an SVG can be selected and read by assistive technology, but only if the SVG is inline or has a proper description; as an
<img>, it still needs alternative text like any image.
What we do on this site, and why
This site publishes its charts as lossless WebP images because WordPress’s media library generates responsive sizes for them, and because the result is identical on every device. This test shows the price: about 25 KB per chart at 1×, roughly thirty times the Brotli-compressed SVG. For a page with three charts, that is about 70 KB that SVG would avoid. A palette PNG would be another option for flat-colour charts.
Practical conclusion
For simple bar and line charts, SVG sent with Brotli was 26 to 140 times smaller than any raster format and stays sharp at any density. Use SVG for charts when your publishing system supports it; when it must be a raster image, use lossless WebP or AVIF, never JPEG.
Limitations
Eight charts of one simple style, rendered with librsvg. Charts with photographs, gradients or many thousands of elements will produce different ratios. We did not measure drawing time in the browser.
Data and files
Download chart-formats.csv (8 rows, 1.0 KB) · Method: testing methodology.