Resize Kernels Compared: Lanczos3, Mitchell, Linear and More
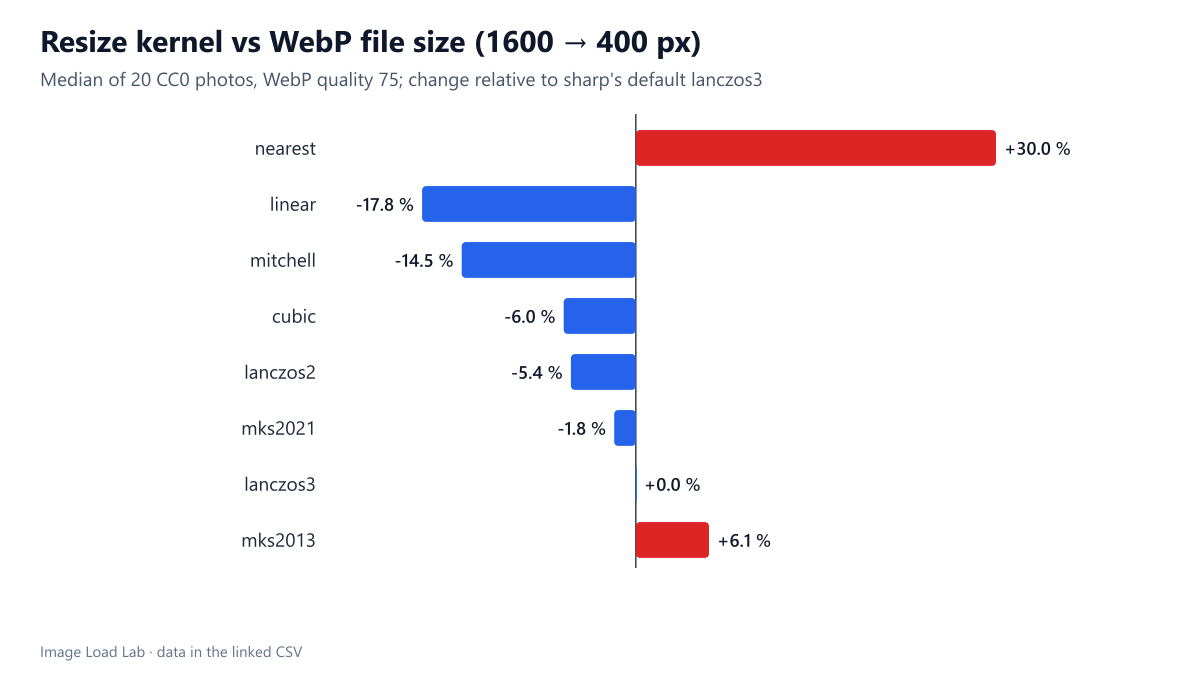
The resize kernel changed 400-pixel thumbnails by up to 30 % in file size: linear and mitchell were 15 to 18 % smaller than lanczos3 but softer, and nearest-neighbour was 30 % larger.
Every responsive image starts with a resize: a 1600-pixel photo becomes a 400-pixel thumbnail. Image libraries let you choose the resampling kernel, the formula that decides how source pixels are combined, and sharp alone offers eight. Does the kernel change what the thumbnail looks like, and does it change how many bytes the thumbnail costs? We reduced 20 photos and a test pattern with every kernel.
The test
Each of our 20 CC0 photos (1600 pixels wide) was reduced to 400 pixels with sharp 0.35.5 using nearest, linear, cubic, mitchell, lanczos2, lanczos3 (sharp’s default), mks2013 and mks2021. Each result was saved losslessly to measure its sharpness (the variance of the Laplacian, a standard index that grows with fine detail and noise) and as WebP at quality 75 to measure the cost in bytes.
Photos cannot tell you what a “correct” thumbnail looks like, so we added a zone plate: a synthetic pattern of rings, generated by code, whose detail gets finer towards the edges. We reduced it from 1600 to 400 pixels with each kernel and compared the result with an ideal rendering made directly at 400 pixels, in which every detail too fine for the 400-pixel grid is replaced by flat grey. Two numbers come out of that: how much of the contrast of the detail the grid can show was kept (100 % is exact), and how much false detail appeared where the ideal is flat grey (0 is none). See our methodology.
Results
| Kernel | Photos: sharpness index | Photos: WebP q75, median KB | vs lanczos3 | Zone plate: fine-detail contrast kept | Zone plate: false detail (RMS) |
|---|---|---|---|---|---|
| nearest | 3,625 | 20.34 | +30.0 % | 110 % | 90.2 |
| linear | 615 | 13.06 | −17.8 % | 87 % | 4.5 |
| mitchell | 703 | 13.52 | −14.5 % | 93 % | 5.0 |
| cubic | 1,016 | 14.90 | −6.0 % | 102 % | 6.8 |
| lanczos2 | 1,035 | 14.95 | −5.4 % | 102 % | 6.8 |
| mks2021 | 1,209 | 15.41 | −1.8 % | 106 % | 7.4 |
| lanczos3 | 1,282 | 15.68 | +0.0 % | 109 % | 7.1 |
| mks2013 | 1,550 | 16.88 | +6.1 % | 116 % | 8.2 |
The kernel changed the thumbnail’s file size by up to 30 %. Compared with lanczos3, the softer linear and mitchell kernels made WebP thumbnails 17.8 % and 14.5 % smaller, cubic and lanczos2 about 6 % smaller, mks2021 1.8 % smaller, and the sharper mks2013 6.1 % larger. Nearest-neighbour, which simply picks one source pixel, made files 30.0 % larger.
Smaller files came from softer images. The sharpness index followed file size closely: linear (615) and mitchell (703) produced the softest thumbnails, lanczos3 (1,282) and mks2013 (1,550) the crispest. Fine detail costs bytes in any lossy format, so a softer resize is a hidden form of compression.
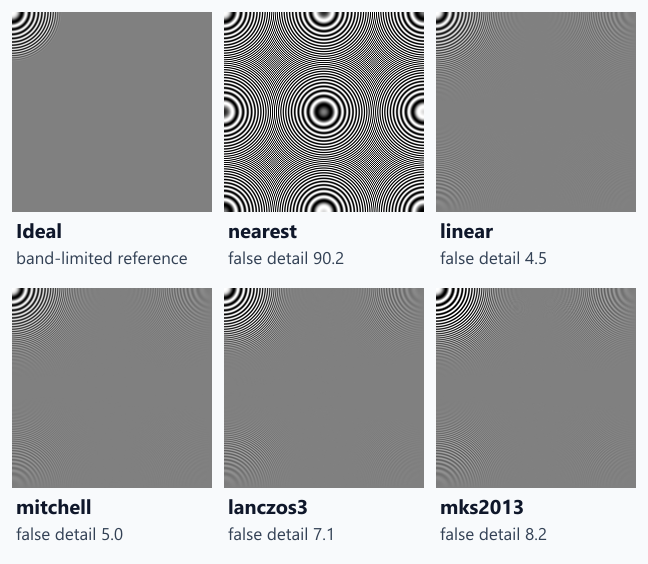
The test pattern shows the trade-off. Nearest-neighbour was in a class of its own: it kept detail at full contrast but filled the area that should be grey with strong false rings (false-detail value 90.2). Among the others, linear and mitchell produced the least false detail (4.5 and 5.0) but kept only 87 % and 93 % of the real detail’s contrast. Cubic and lanczos2 kept it almost exactly (102 %) with a little more false detail (6.8). Lanczos3 (109 %) and especially mks2013 (117 %) exaggerated fine detail, which looks crisp but also produced the most false rings after nearest (7.1 and 8.2).
Choosing a kernel
- Keep lanczos3, the default, for photos that should look crisp at small sizes. Its slight exaggeration of detail is what most people perceive as sharp.
- Use mitchell or cubic for very small thumbnails where texture would turn into noise; they made files 6–15 % smaller and looked smoother.
- Never use nearest-neighbour for photos. It cost 30 % more bytes and produced the worst false detail; it is only for pixel art scaled by whole numbers.
- mks2013 sharpens as it resizes. If you add sharpening after resizing anyway, do not combine it with mks2013; our test of sharpening after resizing shows what that costs.
Practical conclusion
The resize kernel is a quiet quality and size setting: from linear to mks2013, the same 400-pixel thumbnails ranged from 17.8 % smaller to 6.1 % larger than with the default lanczos3. Keep lanczos3 for crisp results, pick mitchell or cubic when smaller files and smoother thumbnails matter more, and avoid nearest-neighbour.
Limitations
One reduction ratio (4:1), one output format for the byte measurement and one synthetic pattern. sharp resizes in the image’s encoded (gamma) space by default; resizing in linear light changes how bright fine detail looks and was not tested. Sharpness indices are comparable only within this test.
Data and files
Download resize-kernels.csv (336 rows, 28.5 KB) · Method: testing methodology. Photos: image credits.