Lighthouse Simulated vs Applied Throttling on Image-Heavy Pages
Applied throttling reported LCP 6 to 33 % higher than Lighthouse's default simulation on three pages, and the simulated Speed Index ignored images entirely.
By default, Lighthouse does not actually slow down the page it tests. It loads the page at full speed and then simulates how long each step would have taken on a slow phone and network. It can also apply real throttling through Chrome’s DevTools instead. Do the two methods give the same results for image-heavy pages? We tested three pages both ways.
The test
The three local test pages were a light article with one 800-pixel WebP (36 KB in total), a page with one oversized 1920-pixel JPEG (175 KB) and a page with seven large photos (719 KB). Each was tested three times with Lighthouse 13.5.0’s mobile profile using the default simulate throttling, and three times with devtools throttling, which applies Lighthouse’s network and CPU limits to the real page load. The browser was Chrome 155.0.8059.82 on our desktop. We compared the median score, LCP, FCP and Speed Index. See our methodology.
Results
| Page | Method | Score | LCP | FCP | Speed Index | Page weight |
|---|---|---|---|---|---|---|
| Light page (36 KB) | simulated | 100 | 1,053 ms | 619 ms | 619 ms | 36 KB |
| Light page (36 KB) | applied (DevTools) | 100 | 1,400 ms | 646 ms | 1,118 ms | 36 KB |
| One oversized JPEG (175 KB) | simulated | 100 | 1,803 ms | 621 ms | 621 ms | 175 KB |
| One oversized JPEG (175 KB) | applied (DevTools) | 99 | 2,160 ms | 640 ms | 2,034 ms | 175 KB |
| Seven large photos (719 KB) | simulated | 87 | 4,057 ms | 624 ms | 624 ms | 719 KB |
| Seven large photos (719 KB) | applied (DevTools) | 85 | 4,292 ms | 646 ms | 2,235 ms | 719 KB |
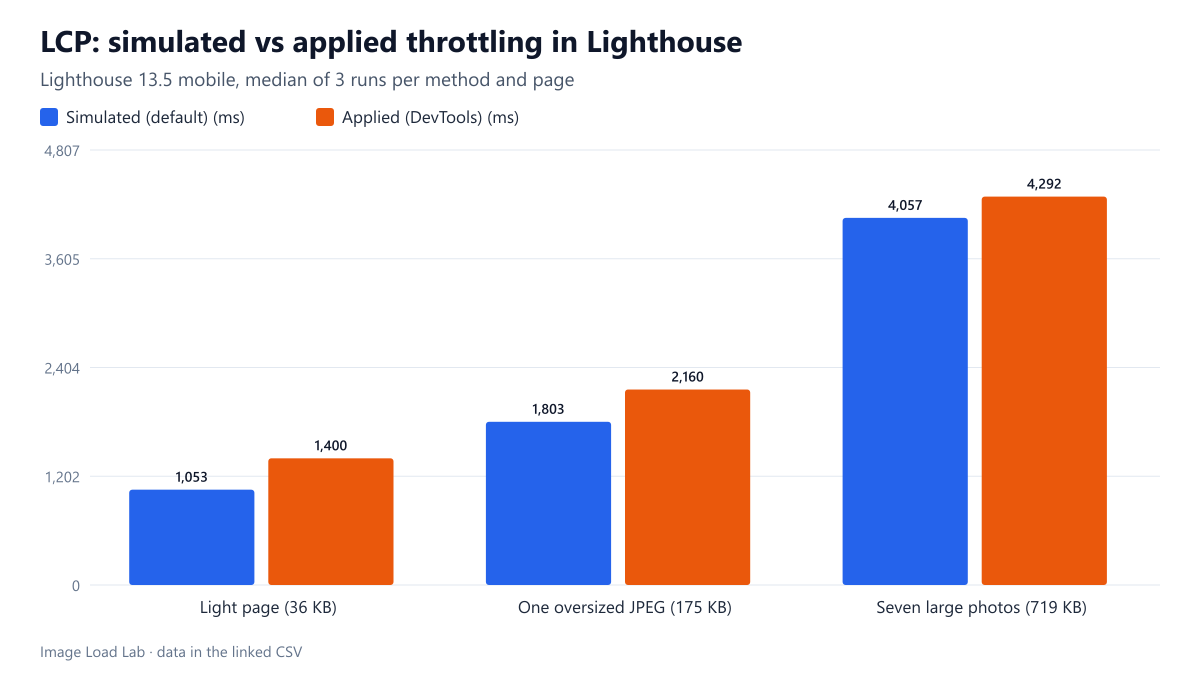
Applied throttling reported a later LCP on every page. The light page went from 1,053 ms simulated to 1,400 ms applied (+33 %), the oversized JPEG from 1,803 to 2,160 ms (+20 %) and the seven-photo page from 4,057 to 4,292 ms (+6 %). Scores stayed close (100 against 100, 100 against 99, 87 against 85), because these differences did not cross the scoring thresholds that matter.
Speed Index differed most. With simulation, Speed Index equalled First Contentful Paint on all three pages, about 620 ms, as if the page were visually complete at its first paint. With applied throttling, Speed Index was 1,118, 2,034 and 2,235 ms, reflecting the images arriving gradually. On image-heavy pages, the simulated Speed Index said almost nothing about how long the images took to appear.
Both methods were stable. The three runs of each method varied by a few tens of milliseconds at most on these local pages, so the gap between methods is not run-to-run noise; our variance test shows how much larger the noise is on a live website.
Which to use
- Use the default simulation for routine checks and comparisons over time. It is fast and very repeatable, and it is what PageSpeed Insights reports.
- Use applied throttling when the question is about images arriving, such as lazy loading, priorities or progressive rendering. The simulated Speed Index ignored the images entirely in our test.
- Never mix methods in one comparison. A change that “saved 350 ms of LCP” may simply be a switch from applied to simulated measurement.
- Our own loading tests use applied throttling through Chrome’s DevTools Protocol, with medians of several runs, as described in our methodology.
Practical conclusion
Lighthouse’s default simulated throttling reported LCP 6–33 % lower than applied throttling on our three test pages and set Speed Index equal to the first paint, while applied throttling showed images arriving over 1.1 to 2.2 seconds. Keep to one method per comparison, and use applied throttling when you are studying how images load.
Limitations
Three simple local pages; on real sites with many resources and servers far away, the two methods can differ in other ways. Applied throttling in Chrome adds latency per request rather than modelling real network behaviour exactly.
Data and files
Download lighthouse-throttling-methods.csv (6 rows, 0.4 KB) · Method: testing methodology.