How Much Do Lighthouse Results Vary Between Identical Runs?
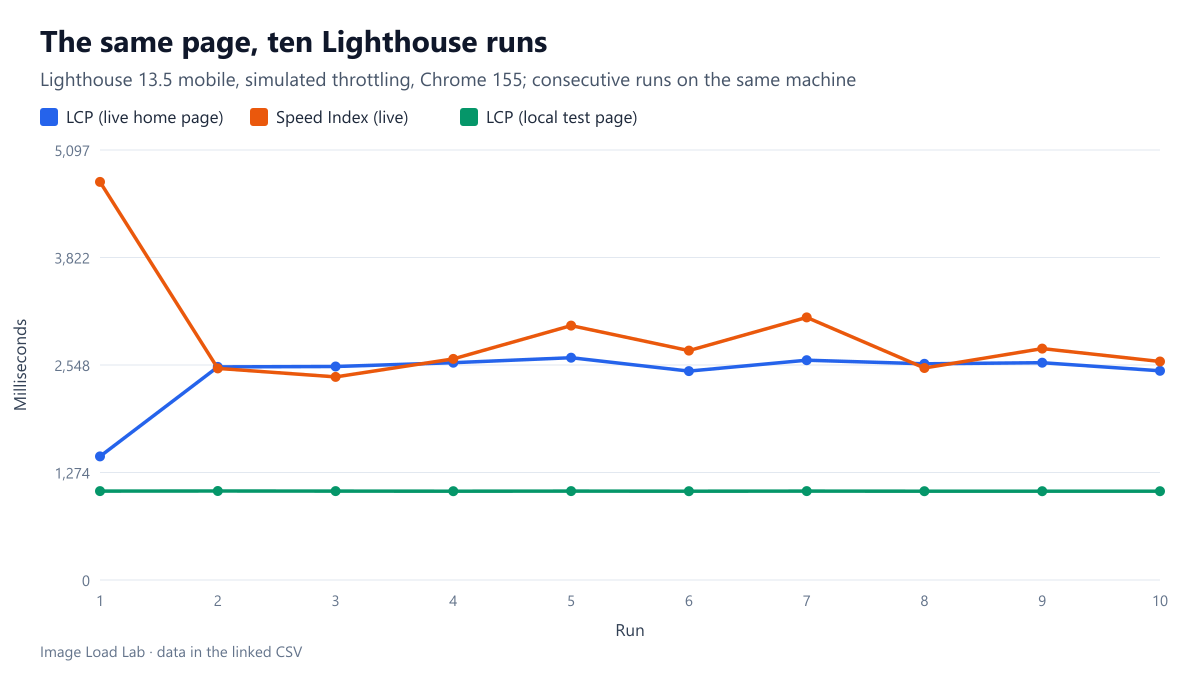
On a local page, 15 Lighthouse runs all scored 100 with LCP within 3 ms. On our live home page, ten runs scored 94 to 97 while LCP spread from 1.5 to 2.6 seconds.
Run Lighthouse twice on the same page and the numbers rarely match. Site owners often chase a few points of score or a hundred milliseconds of LCP that are within normal run-to-run variation. How much do Lighthouse results move between identical runs, on a simple local page and on a real website with advertising? We ran it 15 times on a local test page and 10 times on our own home page.
The test
Both series used Lighthouse 13.5.0 with its default mobile profile and simulated throttling, in Chrome 155.0.8059.82 on our desktop, each run in a fresh browser profile, one after another. The local page was a short article with one 800-pixel WebP hero, served from the same machine. The live page was the imageloadlab.com home page, a WordPress page served through a page cache, with Google AdSense code and real network conditions. We recorded the performance score, the main metrics and Lighthouse’s CPU benchmark index, which it measures at the start of each run. See our methodology.
Results
| Metric | Local test page (15 runs) | Live home page (10 runs) |
|---|---|---|
| Performance score | 100 – 100 | 94 – 97 |
| LCP (ms) | 1,052 – 1,055 | 1,465 – 2,635 |
| FCP (ms) | 617 – 627 | 1,287 – 1,675 |
| Total Blocking Time (ms) | 0 – 0 | 20 – 124 |
| Speed Index (ms) | 617 – 627 | 2,407 – 4,719 |
| CLS | 0 – 0 | 0.000 – 0.000 |
| Lighthouse CPU benchmark index | 3,290 – 4,016 | 3,188 – 4,024 |
The local page did not move. All 15 runs scored 100, with LCP between 1,052 and 1,055 ms. With no network variation and no third-party code, Lighthouse’s simulation is almost perfectly repeatable, even though the CPU benchmark varied by 22 % between runs.
The live page moved a lot in its metrics, little in its score. The ten runs scored between 94 and 97. LCP ranged from 1,465 to 2,635 ms, Speed Index from 2,407 to 4,719 ms and Total Blocking Time from 20 to 124 ms. A single run could therefore suggest that LCP had improved or worsened by more than a second when nothing had changed.
CLS was zero in every run. That confirms, on the live site, the fix described in our layout shift investigation: before it, the same home page measured a CLS of 0.5 to 1.0.
Where the variation comes from
- Real network and server timing. Each run downloads the page and its resources again; server response time and network conditions differ from run to run, and the simulation starts from those observed timings.
- Third-party code. Advertising and analytics scripts load different resources on different runs. They add main-thread work, which shows up in Total Blocking Time and Speed Index.
- The measuring machine. Lighthouse’s CPU benchmark index changed by about a quarter between runs on the same computer, a sign that the machine itself was not equally fast in every run.
How to use Lighthouse without chasing noise
- Run it at least five times and compare medians, as we do throughout this site. A difference smaller than the spread of single runs is not a result.
- Compare before and after on the same machine, at the same time of day, and on a local or staging copy when testing a change of your own code.
- Read the metrics, not just the score. The score barely moved here while LCP varied by 1.2 seconds; the score’s thresholds absorb a lot.
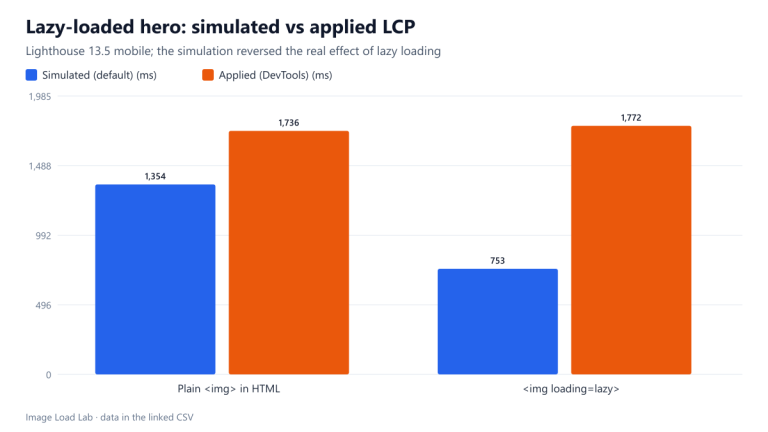
- Check the method too: simulated and applied throttling can give different answers for the same page, as our throttling comparison shows.
Practical conclusion
On a local test page, Lighthouse 13.5 was almost perfectly repeatable: 15 runs of 100 with LCP within 3 ms. On our live home page, ten runs scored 94 to 97 while LCP spread from 1.5 to 2.6 seconds. Use medians of several runs, and treat single-run differences of a second in LCP as noise until repeated.
Limitations
One machine, one live page and runs taken within a few minutes; variation over a day, or on other networks, may be larger. We did not break down which element was the LCP in each live run.
Data and files
Download lighthouse-variance.csv (25 rows, 1.3 KB) · Method: testing methodology.