What a Page Cache Did to This Site’s Server Response Time
Enabling the page cache cut our HTML response time from 358 to 420 ms down to about 193 ms, as fast as a static image. Uncached search and API requests did not change.
Before the browser can request a single image, it needs the HTML page that lists it. On a WordPress site, that HTML is normally built by PHP on every visit, unless a page cache stores a ready-made copy. This site had a caching plugin installed, but its page cache was switched off. On October 18, 2026 we measured the server’s response time, switched the cache on and measured again. How much time does a page cache save on this shared host, and which requests does it not help?
The test
We requested six kinds of URL from imageloadlab.com:
- the home page;
- a guide;
- the guide index;
- a search results page and a REST API request, which are never cached;
- a static image file, which is served without PHP.
A Python script using the requests library sent 20 rounds of the six requests over one kept-alive HTTPS connection, with half a second between requests. For each request it recorded the time until the response headers arrived. Opening the connection beforehand kept DNS, TCP and TLS setup out of the numbers.
The cache is the SpeedyCache plugin’s page cache, set to keep pages for 10 hours. We left its HTML, CSS and JavaScript minification and its “defer JavaScript” option switched off, so that it would not alter our inline styles or the advertising script. Browser caching and GZIP were already enabled before the test. See our methodology.
Results
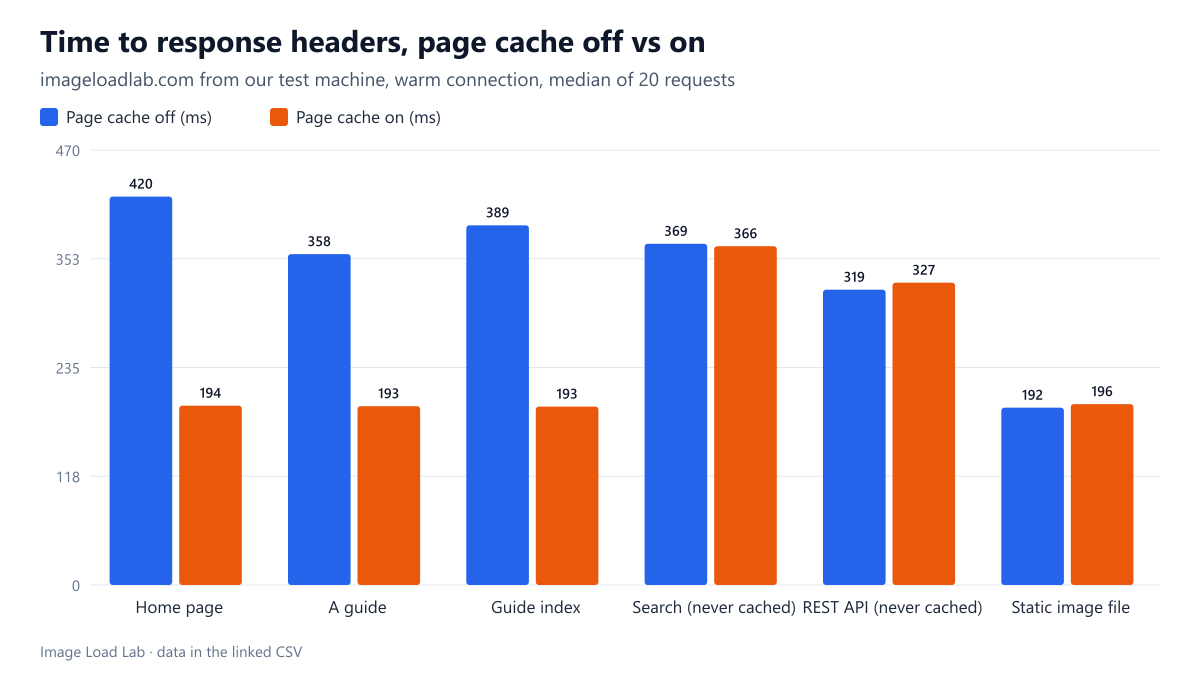
| Request | Cache off (median) | Cache on (median) | Change |
|---|---|---|---|
| Home page | 420 ms | 194 ms | −226 ms |
| A guide | 358 ms | 193 ms | −164 ms |
| Guide index | 389 ms | 193 ms | −196 ms |
| Search (never cached) | 369 ms | 366 ms | −3 ms |
| REST API (never cached) | 319 ms | 327 ms | +8 ms |
| Static image file | 192 ms | 196 ms | +4 ms |
Cached pages answered in about 193 ms instead of 358–420 ms, a saving of 164 to 226 ms on every HTML page. All 20 requests for each cached page were served from the cache, and none took more than 200 ms.
193 ms is the floor from our test machine. The static image file, which never touches PHP, took 192–196 ms at the median before and after. That is essentially the network round trip between our test machine and the server. Cached pages now arrive as fast as an image file, so from here we cannot measure any remaining server time.
Uncached requests did not change. Search results took 369 and 366 ms; the REST API took 319 and 327 ms. Subtracting the 192 ms round trip, WordPress spent roughly 130 to 230 ms generating each response on this host. That is the time the page cache removes for cached pages.
A new connection costs far more. For comparison, a request on a brand-new connection, including DNS, TCP and TLS before a small file, took a median of 1,046 ms. A first-time visitor pays that cost once per site, and again for every other domain the page loads images from. That is one more reason the old trick of spreading images over several domains is no longer useful under HTTP/2, as our HTTP/2 test explains.
Why this matters for images
The HTML is the first link in the chain that ends with the hero image. The browser cannot discover an <img> until the HTML containing it starts arriving, so every millisecond saved on the HTML response moves the image request, and the Largest Contentful Paint, earlier by the same amount. In our hero bytes test, LCP was a fixed part plus the image’s download time; server response time is part of that fixed part. A page cache does nothing for the image files themselves, which were already served directly by the web server.
What to check after enabling a page cache
- Confirm it is really serving cached pages. Many plugins add an HTML comment to cached pages; ours adds one that reads “Cache by SpeedyCache”. Check it as a logged-out visitor, because logged-in users normally bypass the cache.
- Keep file optimisation options off unless you test them. Minifying, combining or deferring scripts can break third-party code and inline styles. We enabled only the page cache.
- Expect slower first hits. After a cache expiry, a new post or a cache purge, the first visitor to a page waits for PHP again.
- Dynamic pages stay slow. Search, logged-in pages, carts and API requests cannot be cached this way, so the PHP time above still applies to them.
Practical conclusion
Turning on the page cache cut this site’s HTML response time from 358–420 ms to about 193 ms, the same time a static image takes from our test machine. Uncached search and API responses stayed at 319–369 ms. On a shared WordPress host, a page cache is one of the cheapest ways to start the image chain earlier. Enable it alone first, then add any other optimisation one at a time and test after each.
Limitations
One site on one shared host, measured from one location in one session per state, 20 requests per URL per state. Response time includes the network round trip from our machine, so visitors closer to the server would see smaller absolute numbers, and visitors further away larger ones. We measured the time to response headers, not full page loads.
Data and files
Download host-ttfb-cache-off.csv (130 rows, 6.5 KB) · Download host-ttfb-cache-on.csv (120 rows, 5.5 KB) · Method: testing methodology.