SVGO on Real SVG Files: Savings and Visual Safety
SVGO cut public-domain SVGs from drawing programs by a median 21 to 38 % and by 15 to 18 % after Brotli, with no visible change in our renders. Files written by code saved only 2 to 4 %.
SVG files exported from drawing programs carry a lot of text the browser does not need: editor metadata, unused definitions, long decimal coordinates and comments. SVGO is the most widely used tool for removing it. How much does SVGO save on real SVG files, does it change what the image looks like, and does the saving survive HTTP compression? We ran it on 28 files from three sources and rendered every file before and after.
The test
The files were 13 public-domain SVGs from Wikimedia Commons (four Tango-style icons, four flags, four scientific diagrams and a map; sources listed on our image credits page), eight charts produced by our own scripts and seven small hand-written test graphics. Each file was optimised with SVGO 4.1.0 using its default preset with multipass enabled. We measured the size before and after, and after gzip (level 9) and Brotli (quality 11), the two compressions a web server applies to text files.
To check that nothing visible changed, both versions of each file were rendered at 800 pixels wide with librsvg and compared pixel by pixel; we report the share of pixels whose colour moved by more than 8 levels out of 255. Our first comparison forced the optimised render to the exact height of the original and reported false differences of up to 10.9 % on two diagrams; rendering each file at its own proportions removed them, and the corrected figures are the ones below. See our methodology.
Results
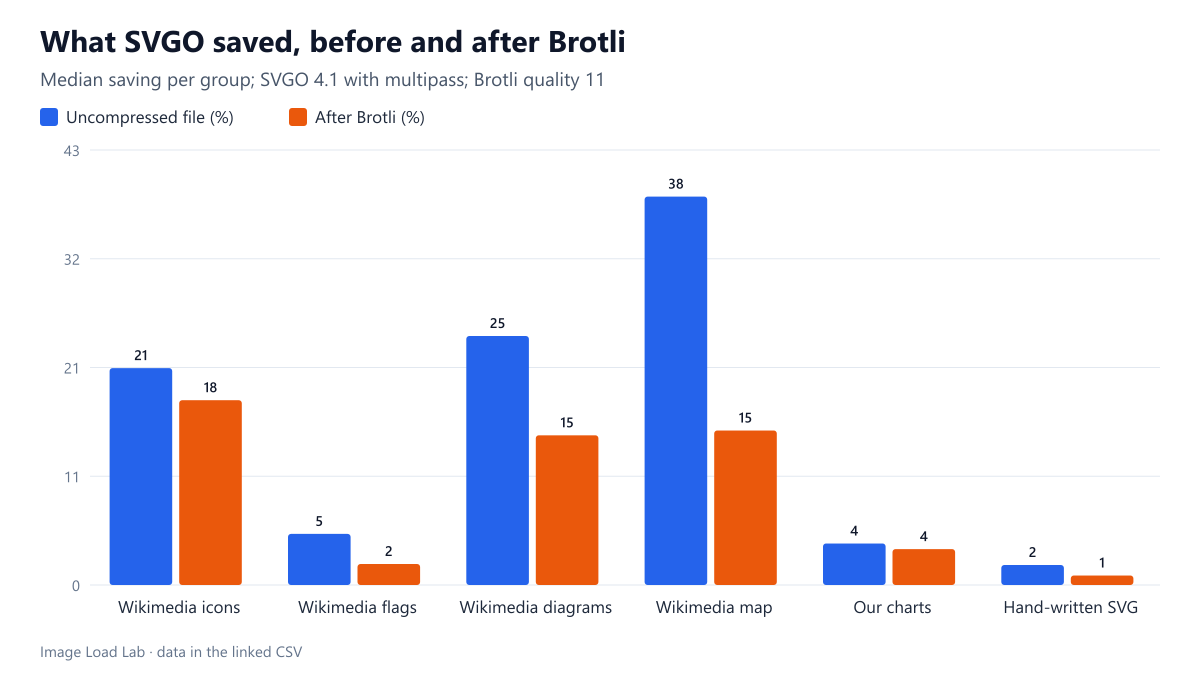
Files from drawing programs shrank a lot. SVGO removed a median 21 % from the Wikimedia icons, 25 % from the diagrams and 38 % from the map. The largest single saving was a historical flag: 358,953 bytes became 153,673, a 57 % cut. Flags drawn with few, simple shapes saved only 5 % at the median.
Machine-written and hand-written SVG barely changed. Our own charts lost a median 4 % and the hand-written test graphics 2 %. When an SVG is generated by a script that writes only what is needed, there is little left for SVGO to remove.
Brotli took much of the saving anyway. Because SVG is text, HTTP compression removes repetition very effectively. After Brotli, SVGO’s median saving fell from 21 % to 18 % for icons, from 25 % to 15 % for diagrams and from 38 % to 15 % for the map. The flag that lost 57 % uncompressed still lost 44 % after Brotli, because SVGO had removed data, not just repetition.
Nothing visible changed. In 24 of the 28 files, fewer than 0.01 % of pixels differed by more than 8 levels; the largest difference was 0.15 % of the pixels of one diagram, too few to notice at normal viewing size.
| SVG file | Original KB | After SVGO KB | Saved | With Brotli: before → after KB | Pixels changed visibly |
|---|---|---|---|---|---|
| Bandera de la República Española (1931-1939) | 350.5 | 150.1 | 57.2 % | 36.1 → 20.1 | 0.06 % |
| Complete neuron cell diagram en | 305.1 | 268.6 | 12.0 % | 77.4 → 72.4 | 0.01 % |
| Atmosphere composition diagram-en | 295.1 | 219.8 | 25.5 % | 69.2 → 63.2 | 0.14 % |
| United States Public Domain Map | 206.3 | 127.3 | 38.3 % | 26.7 → 22.6 | 0.01 % |
| Flagellum base diagram-en | 121.4 | 92.8 | 23.6 % | 32.4 → 25.6 | 0.00 % |
| Flag of Mexico | 114.4 | 114.4 | 0.1 % | 40.1 → 40.1 | 0.00 % |
| Endomembrane system diagram en | 109.0 | 81.2 | 25.5 % | 22.2 → 14.5 | 0.01 % |
| Flag of Guatemala | 54.5 | 53.3 | 2.3 % | 20.5 → 20.0 | 0.00 % |
| b-desc-bytes | 6.8 | 6.7 | 1.9 % | 0.8 → 0.8 | 0.00 % |
| Flag of Soeda, Fukuoka | 6.1 | 5.6 | 7.8 % | 1.6 → 1.6 | 0.00 % |
| b-hidden-bytes | 5.9 | 5.4 | 8.5 % | 0.8 → 0.7 | 0.00 % |
| a-equiv-q | 5.2 | 5.1 | 2.7 % | 0.8 → 0.8 | 0.00 % |
| a-oxipng-curve | 4.9 | 4.7 | 4.5 % | 0.9 → 0.9 | 0.00 % |
| Tango-style question icon | 4.4 | 2.4 | 45.0 % | 1.5 → 1.0 | 0.00 % |
| line-art | 4.4 | 2.6 | 39.6 % | 0.6 → 0.5 | 0.00 % |
| a-dims-bytes | 4.1 | 3.9 | 4.2 % | 0.8 → 0.8 | 0.00 % |
| a-thumbs-saving | 3.7 | 3.5 | 5.1 % | 0.8 → 0.8 | 0.00 % |
| Tango style insert-signature icon | 3.6 | 3.6 | 0.5 % | 1.1 → 1.1 | 0.00 % |
| b-iframes-dist | 3.1 | 3.0 | 3.7 % | 0.6 → 0.6 | 0.00 % |
| Tango style Wikimedia Icon no shadow | 3.0 | 1.8 | 38.1 % | 1.1 → 0.8 | 0.02 % |
| chart-ui | 3.0 | 2.7 | 9.8 % | 0.5 → 0.4 | 0.00 % |
| a-presets-eq | 2.8 | 2.7 | 4.0 % | 0.6 → 0.6 | 0.00 % |
| Tango style ping icon | 1.6 | 1.5 | 4.7 % | 0.6 → 0.6 | 0.00 % |
| flat-illustration | 0.9 | 0.8 | 9.7 % | 0.4 → 0.4 | 0.00 % |
| soft-shadow-badge | 0.6 | 0.6 | 2.0 % | 0.3 → 0.3 | 0.00 % |
| glass-overlay | 0.6 | 0.6 | 0.0 % | 0.3 → 0.3 | 0.00 % |
| gradient | 0.6 | 0.6 | 0.0 % | 0.2 → 0.2 | 0.00 % |
| antialiased-logo | 0.3 | 0.3 | 2.0 % | 0.2 → 0.2 | 0.00 % |
When to use SVGO
- Always for SVGs exported from Inkscape, Illustrator, Figma or similar tools. They saved 15–18 % even after Brotli in our test, and up to 44 % for one file.
- Do not expect much from already lean files. Icons from a well-made icon set or SVGs written by code saved a few percent.
- Keep the original. SVGO’s defaults removed nothing visible here, but some plugins remove IDs or the
viewBoxthat scripts or CSS may rely on; check interactive or animated SVGs by hand. - Make sure the server compresses SVG. That matters even more than SVGO, as our SVG compression test shows.
Practical conclusion
SVGO with its default preset cut real-world SVGs from drawing programs by a median 21–38 % uncompressed and 15–18 % after Brotli, without any visible change in our renders. Run it on every exported SVG; for files generated by code, the gain is small.
Limitations
28 files, one SVGO version and one renderer (librsvg); browsers render SVG with their own engines, but the same geometry. SVGO took a median of 3 ms per file and at most 0.49 seconds, so speed is not a concern for build pipelines.
Data and files
Download svgo.csv (28 rows, 2.8 KB) · Method: testing methodology. SVG sources: image credits.